This project takes future climate projections and uses them to produce estimates of future species distributions. This process involves several steps.
Generating species distributions
Species occurrences were vetted, as much as possible given the size of the dataset, for accuracy and plausibility. These occurrences were compared statistically to current climate data at 10 arc minutes geographic resolution (often referred to as “20 km” resolution) to produce a statistical model that predicts species occurrence probability given specified climate values. This model is known as a Species Distribution Model or SDM and one was created for each species.
Using the SDM and current climate conditions, a climate suitability map was created for each species. These suitability maps were then clipped using a set of parameters (see Warren et al 2013, Supplemental Material) to produce an estimate of the current species distribution.
Projecting future climate
Future climate projections must account for a broad range of factors, such as population growth, land use, energy demand, and new technology. In the past the Intergovernmental Panel on Climate Change (IPCC) defined defined a set of scenarios to represent potential futures. However, starting with the fifth assessment report these were changed to represent potential future levels of radiative climate forcings through what are known as Representative Concentration Pathways or RCPs. This allows for differing changes in technology, population, etc to potentially lead to the same level of climate change.
Rather than deal with multiple different possible scenarios occurring over different times (the way previous studies have looked at change) this project looks at the potential impacts on biodiversity at different amounts of warming above pre-industrial levels – these are referred to as specific warming levels. These were drawn from versions of the RCPs produced for the UK Government as part of their AVOID2 project, and more detail can be found at Warren et al 2018, Climatic Change. The advantage to this approach is that it is more adaptation friendly and provides outcomes that better tie in with stated policy goals (e.g., to hold temperature to less than 2°C). 21 different global climate models or GCMs were used to generate climate projections for each selected temperature step. For dispersal allowed a species to disperse for up to 100 years. This is mostly relevant for warming levels of 1.5°C and 2°C where species may be able to keep up, or catch up, to the new climatic range.
Projecting future species distributions
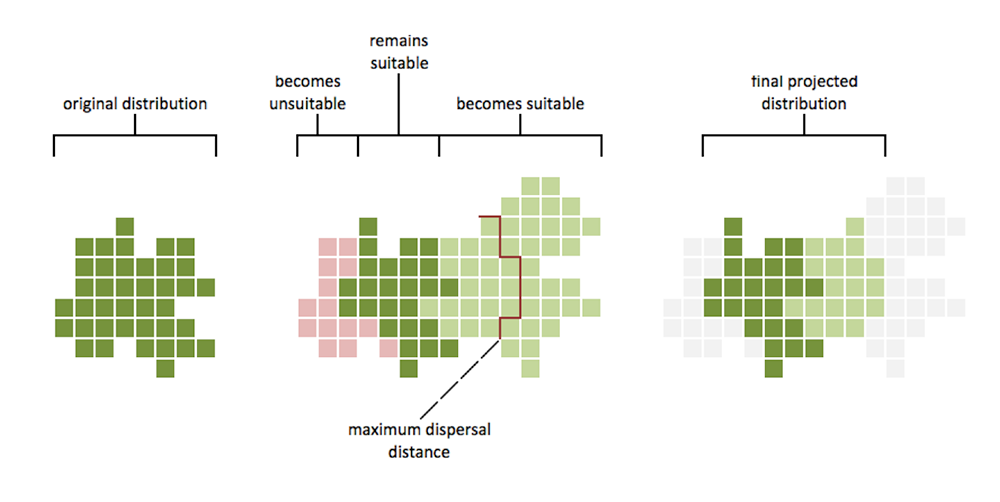
The future climate projections were then run through the SDM for each species to create projected future climate suitability maps. The maps allow you to look at either the situation where a species is unable to undertake any climate mediated dispersal (e.g. barriers or slow dispersal rates) or allowed to move (tick the allow species to move button) based on a realistic dispersal rate to remove areas that had newly suitable climate but could not be reached by the species. A diagram demonstrating this process is shown below. More on dispersal rates can be found in Warren et al 2013, Supplemental material.
The projections of different GCMs, with and without movement, were summarised using the median or 50th percentile as a "best estimate" or “central tendency”, and then summarised again at 10th, 33rd, 66th, and 90th percentiles to give an indication of variability between climate models to help assess uncertainty. This summarising across models produced the projected species distribution maps displayed in the Wallace Initiative map interface.
Generating biodiversity values
Maps for the species in each given taxa, family, and some genera were reduced to a binary value of present or not-present. Calculating the number of different species present at a given point (with 10th, 33rd, 50th, 66th and 90th percentile summaries across GCMs) produced the biodiversity maps available in the map interface.